The title, descriptive subtitle and Interreg BSR logo
The project logo is mandatory as this assessment is uploaded to the database built with ERDF co-funding. Free mobility icon on the left without any attribution of credit needed can be found from PowerPoint Icons or online resources such as uxwing.com or pixabay.com
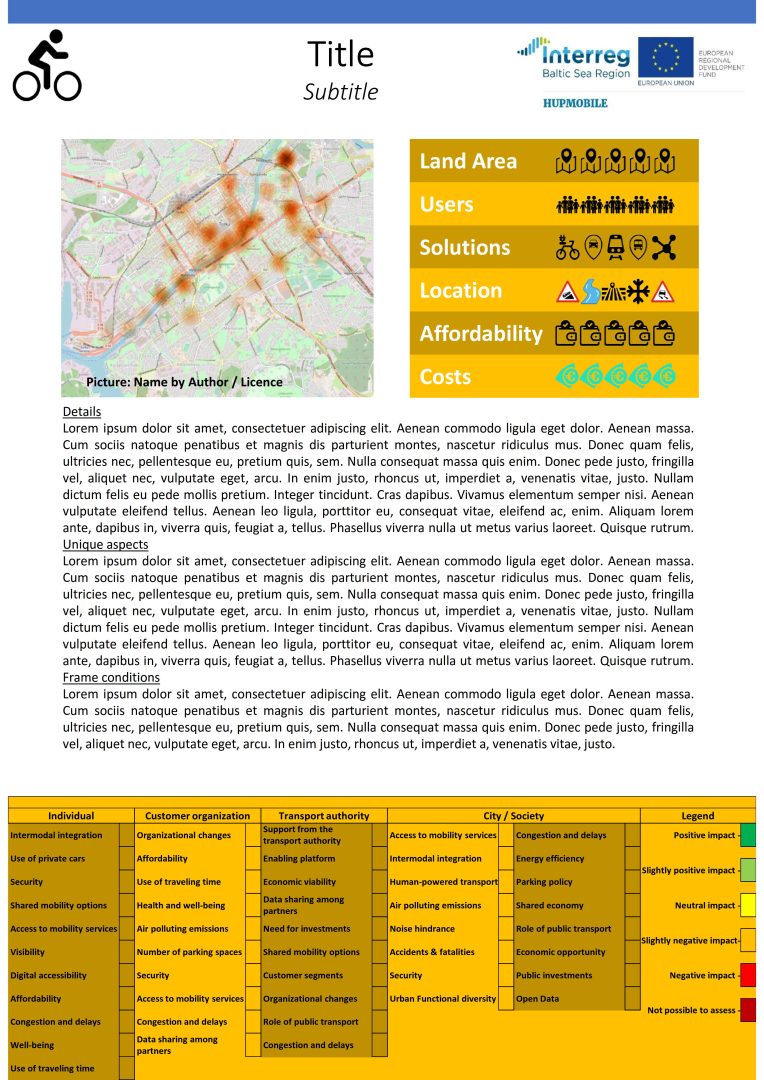
Descriptive picture and operating conditions
Value-adding illustration – with attribution if needed. You can find more information about the operating conditions categories in this document and from below.
Details
About 750 characters for describing the scale of the solution and costs related to starting and operating the mobility solution.
Unique aspects
About 750 characters for describing the value-adding and innovative aspects of the solution in question. Aspects and lessons learned should be taken into account when thinking about the solution’s applicability elsewhere.
Frame conditions
About 500 characters for describing the important conditions in the area that helped the implementation of the solution and should probably be taken into account when thinking about the transferability of the solution.
Assessment field
Can be left out in the assessment process and included (with the assessment result) when communicating the results through the HUPMOBILE database or other ways.
Characteristics of the target area – remove unwanted icons from the template table according to the scale described below and in the background material.
Land Area
The size of the land area that the new mobility solution is aimed for affecting: 1 tile – Under 5 km2; 2 tiles – Between 5 km2 and 25 km2; 3 tiles – Between 25 km2 and 100 km2; 4 tiles – Between 100 km2 and 400 km2; 5 tiles – Over 400 km2
Users
The size of the potential user group that the new mobility solution is aimed for in the target area: 1 tile – Under 20 000; 2 tiles -Between 20 000 and 100 000; 3 tiles – Between 100 000 and 300 000; 4 tiles – Between 300 000 and 1 000 000; 5 tiles – Over 1 000 000
Solutions
Access to existing (complementary, competing or potentially substituting) mobility solutions in the target area (from left to right): 1. tile – There is an area-wide bike, scooter or similar last-mile vehicle sharing system in operation; 2. tile – There is an area-wide car-sharing system in operation; 3. tile – There is an area-wide rail-based transport system in operation; 4. tile – The public transport network coverage is good (no longer than 800m to the nearest mobility hub with many transport options); 5. tile – The public transport network coverage is excellent (no longer than 400m to the nearest mobility hub with many transport options)
Location
Geographical aspects potentially affecting the possibilities that the city has regarding new mobility solutions (from left to right): 1. tile – There are considerable vertical changes in the topography of the area in question (for example, favoring motorized/electric versions of small vehicles); 2. tile – The area in question is characterized by landform surrounded by water (peninsula) or is divided by a large river (for example, limiting the land area used for mobility solutions or favoring water-based transport); 3. tile – The area in question is characterized by a large transport node that creates traffic flows (for example, TEN-T port); 4. tile – The area in question is affected by severe snow conditions in the winter (for example, some mobility solutions, such as shared scooters, cannot be used during winter months); 5. tile – In addition to some or all the three scale items above (1-3), the area in question is affected by severe snow conditions in the winter
Affordability
Your expert opinion about the share of the transport costs for fulfilling basic needs in the household budget of the poorest quartile of the population: 1 tile – The financial cost of monthly journeys put a low-income individual or household in the position of having to make sacrifices to travel or the extent to which they can afford to travel when they want to; 2 tiles – Compared to the previous item, low-income individual or household can make necessary journeys to work, school, health and other social services or urgent other journeys without having to curtail other essential activities; 3 tiles – Public transportation is subsidized to the extent that the cost of monthly essential journeys does not exceed 10% of the average monthly income of a low-income individual or household; 4 tiles – Public transportation is subsidized to the extent that the cost of monthly essential journeys does not exceed 10% of the average monthly income of low income individual or household and there are affordable tickets to vulnerable groups; 5 tiles – Public transportation is free for vulnerable to exclusion groups (or to all)
Costs
Estimated or documented costs of starting and operating the solution for a year per potential user of the solution. Do not include required public investment costs (not solution-specific investments) in your assessment: 1. tile – The costs per potential user are between 0 to 10 euros per user; 2. tile – The costs per potential user are between 10 to 20 euros per user; 3. tile – The costs per potential user are between 20 to 100 euros per user; 4. tile – The costs per potential user are between 100 to 500 euros per user; 5. tile – The costs per potential user are over 500 euros per user.